When we talk about performance in system design, one term appears everywhere – latency.
It's one of the most important metrics that defines how fast a system responds, and it directly impacts user experience, scalability, and reliability.
What is Latency?
Latency is the delay between the initiation of an action and the moment its effect is observed. In the context of system design, it is the time taken for a request to travel from the client to the server, be processed, and for the response to return to the client. Lower latency typically means a more responsive system i.e., Lower latency means much better performance.
Browser (client) sends a signal to the server whenever a request is made. Servers process the request, retrieve the information and send it back to the client. So, latency is the time interval between start of a request from the client end to delivering the result back to the client by the server i.e. the round trip time between client and server.
Example:
When you click on “Buy Now” on Amazon:
- Your request goes to the backend server.
- The server processes it, checks inventory, payment, and database.
- You get a confirmation response.
If this entire round trip takes 350 milliseconds, that's your latency.
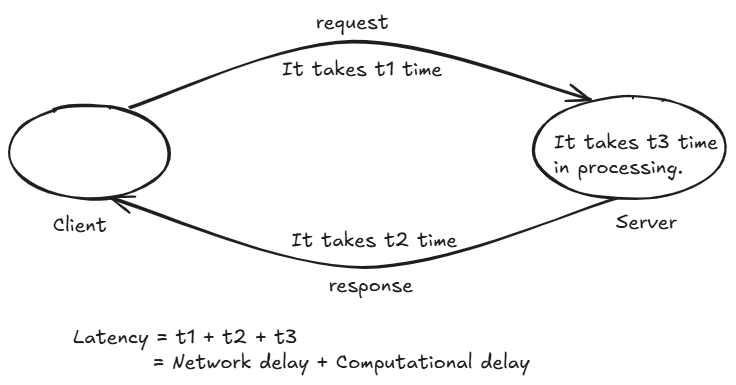
For monolithic system it is just Computational delay.
While for distributed system it is Network delay + Computational delay.
Example:
Suppose a user clicks:
LoginTimeline:
10:00:00:000 Request Sent

10:00:00:150 Response Received
Latency:
150 millisecondsThe user waited 150 ms.
Latency = 150 msWhy Latency Matters
Humans are extremely sensitive to delays.
Research has shown that even small increases in latency significantly affect user experience.
Human Perception of Latency
| Latency | User Perception |
|---|---|
| <10 ms | Feels instantaneous |
| <100 ms | Feels immediate |
| 100-300 ms | Slight delay |
| 300-1000 ms | Noticeable |
| 1-3 seconds | Slow |
| >5 seconds | Frustrating |
| >10 seconds | Many users leave |
Real Example
Imagine Google Search
You type:
System Design TutorialIf results appear:
50 msIt feels instant.
If results appear:
5 secondsGoogle suddenly feels broken.
Same functionality.
Different latency.
Completely different user experience.
Why Latency Exists
A request does not magically travel from a user to a server.
Many operations occur.
Example:
Browser
 ↓
Internet
 ↓
Load Balancer
 ↓
API Server
 ↓
Cache
 ↓
Database
 ↓
API Server
 ↓
Browser
Every step consumes time.
Total latency is the sum of all these delays.
How does Latency Work?
Latency is simply the estimated amount of time a client waits after initiating a request until the result is received. Consider the following example from an e-commerce website:
- When you click the "Add to Cart" button, the latency timer starts as your browser sends a request to the server.
- The server receives and processes this request.
- Once processed, the server sends a response back to your browser, and the product is added to your cart.
If you were to measure the time from when you pressed the button to when the product appears in your cart, that duration represents the system's latency.
What Causes Latency?
Latency is influenced by several factors that can add delays to a system. For instance, when you click the "Add to Cart" button on an e-commerce site, your browser sends a request to a backend server. This server might need to call several other services—either in parallel or sequentially—to complete the transaction, and each of these outbound calls adds to the overall latency.
Key factors that contribute to latency include:
- Transmission Mediums:
The physical connection used to transmit data—such as WAN links or fiber optic cables—plays a crucial role. Each medium has its own limitations and affects the speed at which data travels between endpoints. - Propagation:
The distance between communicating nodes is significant. The farther apart these nodes are, the longer it takes for data to travel between them, thereby increasing latency. - Routers:
Routers process packets by analyzing their header information. Every hop a packet makes from one router to another adds a small delay, and multiple hops can cumulatively increase the overall latency. - Storage Delays:
The type of storage system used can also affect latency. Accessing data from storage systems—especially if the data must be processed or retrieved from slower storage types—can introduce additional delays.
Overall, these factors combine to determine how quickly a system can process and respond to a request.
How to Measure Latency ?
Latency can be measured using several techniques, depending on what aspect of the system you want to evaluate. Here are some common methods:
1 Network Tools
- Ping:
Sends ICMP echo requests to a target and measures the round-trip time (RTT) which gives an indication of network latency.
ping www.anonymous.com This ping output shows that your computer successfully sent four small data packets (32 bytes each) to the host "____" (IP address __.__.__.__) and received a reply for each one. Here’s what each part means: "Pinging anonymous.com [__.__.__.__] with 32 bytes of data:" Your computer is sending packets of 32 bytes to the specified IP address. Individual Reply Lines: For each packet, you see a reply such as: bytes=32: The reply contains 32 bytes of data. time=20ms / time=52ms: The time it took for the packet to travel to the server and back (round-trip time). Three replies were fast (20 milliseconds) and one took a bit longer (52 milliseconds). TTL=57: This stands for "Time To Live" and indicates how many hops (routers) the packet could pass through before being discarded. A lower TTL in the reply means the packet has passed through several devices. Ping Statistics: Packets: Sent = 4, Received = 4, Lost = 0 (0% loss): All four packets were successfully returned, meaning there was no packet loss. Round Trip Times: Minimum = 20ms: The fastest reply took 20 milliseconds. Maximum = 52ms: The slowest reply took 52 milliseconds. Average = 28ms: On average, it took 28 milliseconds for a packet to make the round trip.- Traceroute:
- Displays the path that packets take to reach a destination, showing the latency at each hop along the route.
2 Application-Level Metrics
- Time-to-First-Byte (TTFB):
- Measures the time from when a client sends a request until the first byte of the response is received. This metric is often available in browser developer tools or via command-line tools like
curl.
- Measures the time from when a client sends a request until the first byte of the response is received. This metric is often available in browser developer tools or via command-line tools like
- Response Time:
- Records the total time taken from sending a request to receiving the complete response. This can be logged at the server level or tracked using performance monitoring tools.
Latency Optimization
Latency optimization involves a set of strategies aimed at reducing the delay between sending a request and receiving a response. The goal is to create a faster, more responsive system. Here are some key approaches:
1 Network Improvements
- Content Delivery Networks (CDNs):
Cache static resources closer to users, reducing the physical distance data must travel. - Optimized Routing:
Use efficient routing protocols and minimize the number of hops between client and server. - Upgraded Infrastructure:
Employ high-speed connections (like fiber optics) and reduce network congestion.
2 Server and Application Enhancements
- Efficient Code and Algorithms:
Optimize code paths and choose efficient algorithms to process requests faster. - Asynchronous Processing:
Use asynchronous or non-blocking operations to prevent delays during resource-intensive tasks. - Load Balancing:
Distribute incoming requests evenly across servers to prevent any single server from becoming a bottleneck.
3 Data Access Optimization
- Caching Strategies:
Implement in-memory caches (like Redis or Memcached) to store frequently accessed data, reducing database query times. - Database Indexing and Query Optimization:
Optimize database queries and indexes to speed up data retrieval. - Data Partitioning and Replication:
Spread the load by partitioning data across multiple servers or replicating databases.
4 Client-Side Optimization
- Minimize Resource Sizes:
Compress files and optimize images to reduce download times. - Lazy Loading:
Load non-critical resources asynchronously, allowing the user interface to render faster.
Components of Latency
A request's latency can be divided into several parts.
1 Network Latency
Time spent traveling through networks.
Example:
India -> EnglandSignals cannot travel instantly.
Even at nearly the speed of light, distance creates delay.
Causes:
- Physical distance
- Router hops
- Congestion
- Packet loss
- DNS lookup
2 Load Balancer Latency
Many systems place a load balancer before application servers.
Example:
Client
↓
Load Balancer
↓
Server
The load balancer must:
- Accept connection
- Select server
- Forward request
This adds delay.
Typically:
1-10 ms3 Application Latency
Time spent executing business logic.
Example:
Validate user
Check permissions
Calculate response
Serialize JSON
Application processing contributes latency.
Example:
Business Logic = 50Application latency:
50 ms4 Database Latency
Often the largest contributor.
Example:
SELECT * FROM users WHERE id = 1;Database must:
- Parse query
- Locate data
- Read storage
- Return result
Example:
DB Query = 120 msDatabase latency:
120 ms5 Cache Latency
Caches reduce latency dramatically.
Example:
Without cache:
Database = 120 msWith Redis:
Cache = 2 msHuge improvement.
6 Serialization Latency
Servers convert objects into formats like:
{
	"name": "TheJat"
}
This conversion takes time.
Especially for:
- Large JSON
- XML
- Protocol Buffers
- Images
- Videos
Total Latency Formula:
A simplified formula:
Total Latency =
Network
+ Load Balancer
+ Application
+ Database
+ Cache
+ Serialization
Latency in Distributed Systems
Latency becomes more complex when multiple services are involved.
Monolith
Client
 ↓
Application
 ↓
Database
Simple.
Microservices
Client
 ↓
Gateway
 ↓
Auth Service
 ↓
User Service
 ↓
Payment Service
 ↓
Notification Service
 ↓
Database
Each service introduces additional latency.
Example:
Auth Service: 20 ms
User Service: 30 ms
Payment Service: 50 ms
Notification Service: 40 ms

Total = 140 ms
Even though each service is fast, cumulative latency becomes significant.
Tail Latency
When engineers measure application performance, the first number they often look at is the average response time. While averages are useful, they can be misleading. A system with an average latency of 100 ms can still deliver a poor user experience if a small percentage of requests take several seconds to complete.
This is where tail latency becomes important.
What is Tail Latency?
Tail latency referes to the slowest requests in a system, typically measured using high-percentile metrics such as:
- P95 (95th percentile)
- P99 (99th percentile)
- P99.9 (99.9th percentile)
One of the most important concepts in large-scale systems.
Most requests may be fast.
A few may be extremely slow.
Example:
Total 100 Requests

99 Requests = 50 ms
1 Request = 5000 ms
Average: ~100 ms
Looks good.
But one user waited: 5 seconds.
That user had a terrible experience.
Why Average Latency Lies
Suppose:
10
20
30
40
5000
Average: 1020 ms
This number does not represent reality.
Most users saw: 20-40 ms
One user saw: 5000 ms
Average hides the problem.
Percentiles
One of the biggest mistake engineers make is focusing only on average latency. Modern systems use percentiles instead of averages.0
P50 Latency
Median request.
50 % of requests are faster.
Example:

P50 = 50 ms
Half of user experience less than 50 ms
P95 Latency
95 % of requests are faster.
Example:

P95 = 200 ms
95% users experience less than 200 ms
P99 Latency
99% of requests are faster.
Example:

P99 = 500 ms
99% users experience less than 500 ms
Why P99 Matters
Large companies focus heavily on P99.
Examples:
- Amazon
- Netflix
- Meta
Why?
Because slow outliers create unhappy users.
P99 exposes those outliers.
If a customer clicks “Checkout” and their request happens to fall into that slow 1%, they will perceive the application as slow regardless of how fast the other 99% of requests are.
In large-scale systems, even rare slowdowns become common. Consider a web page that depends on 20 backend service.
Example:
| Metric | Latency |
|---|---|
| Average | 100 ms |
| P50 | 80 ms |
| P95 | 300 ms |
| P99 | 1.8 sec |
Although the average latency is only 100 ms, 1% of requests take up to 1.8 seconds. Those slow requests represent the tail of the latency distribution.
Sources of High Latency
Slow Database Queries
Example:
SELECT * FROM orders;Without indexes:
3 secondsNetwork Congestion
Packets wait in queues.
Latency increases.
CPU Saturation
CPU:
100%Requests start waiting.
Memory Pressure
System starts swapping to disk.
Latency explodes.
Strategies to Reduce Latency
Caching
Most effective technique.
Example:
DB = 200 ms
Redis = 2 ms
CDN
Moves content closer to users.
Reduces network latency.
Database Indexing
Reduces query execution time.
Horizontal Scaling
Reduces server overload
Connection Pooling
Avoids connection creation costs.
Asynchronous Processing
Move slow operations to queues.
Example:
Send Email
Generate PDF
Resize Images
Data Localization
Keep data closer to users.
Example:
India Users
↓
India Region
Instead of:
India Users
↓
US Region

Leave a comment
Your email address will not be published. Required fields are marked *